
Using Traceroute, Ping, MTR, and PathPing
Traceroute, Ping, MTR, and PathPing are network tools or utilities that use the ICMP protocol to perform testing to diagnose issues on a network. Internet Control Message Protocol (ICMP) is an error reporting and diagnostic utility. ICMPs are used by routers, intermediary devices, or hosts to communicate updates or error information to other routers, intermediary devices, or hosts.
These tools are usually run at a Microsoft Windows Command Prompt. Most often, these tests would be run if the end user is experiencing the following issues:
- Internet performance slow
- VOIP calls – Poor call quality issues
- Unable to visit certain websites
In these circumstances the problem may be potential packet loss or latency issue. Using these network tools will help identify the fault.
This article describes the following:
Accessing the Windows Command Prompt
To run any of the network tools or utilities described in this article, you need to first open a Windows Command Prompt. To open a command prompt on Windows 8 or Windows 10, proceed as follows.
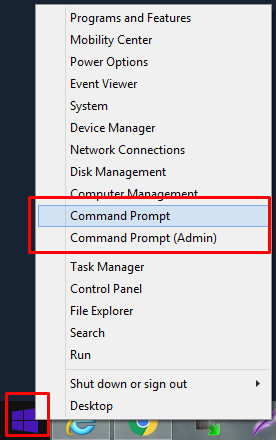
- Right-click on the Start button in the lower-left corner of the screen and, from the menu, select Command Prompt (or Command Prompt (Admin) if the task requires Admin rights).
Note:
For earlier versions of Windows, such as Windows Vista and Windows 7, proceed as follows. Click on the Start icon, then select All Programs > Accessories and finally Command Prompt.
The command prompt window opens.
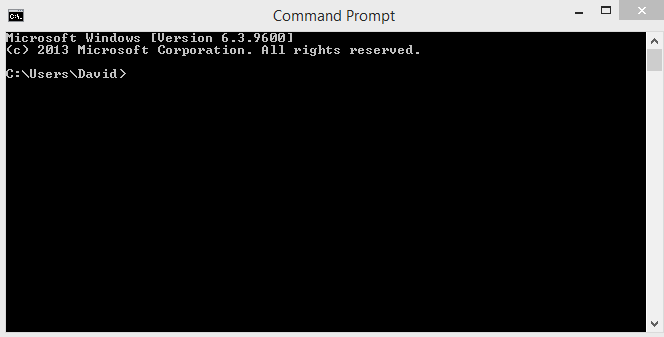
When you want to close the Command Prompt Window, type Exit, then press Return.
Using Traceroute
Traceroute is a computer network diagnostic tool for displaying the route (path), and measuring transit delays, of packets across an Internet Protocol (IP) network. This section shows how to run Traceroute, and how to interpret the results.
Running Traceroute
To run the Traceroute utility, proceed as follows.
- Open a Windows Command Prompt window.
- At the command prompt, type, tracert <domain.ext> (replace <domain.ext> with the domain name and extension that you would like to trace a route to).
It may take a few seconds to respond, but this command will give a traceroute from your computer to the destination you selected.
Note:
You can interrupt Traceroute at any time by holding down the CTRL key, and pressing C on your keyboard.
Copying Traceroute results
To copy the results of your Traceroute, proceed as follows.
- Right click on the Command Prompt Window and, from the menu, click Select All.
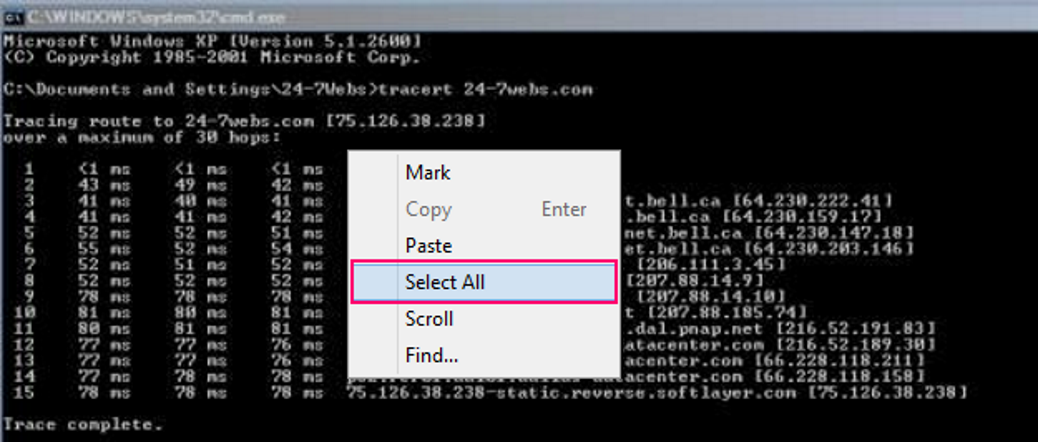
This will copy the contents to your clipboard. The Command Prompt Window contents will turn white with black text.
- Go to the document you want to put the results into, right click and click Paste (or Ctrl-V).
The results are pasted into your document. You may now close the Command Prompt Window.
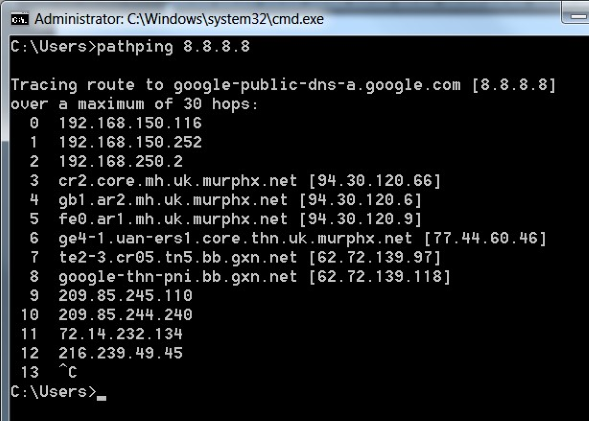
Understanding Traceroute results
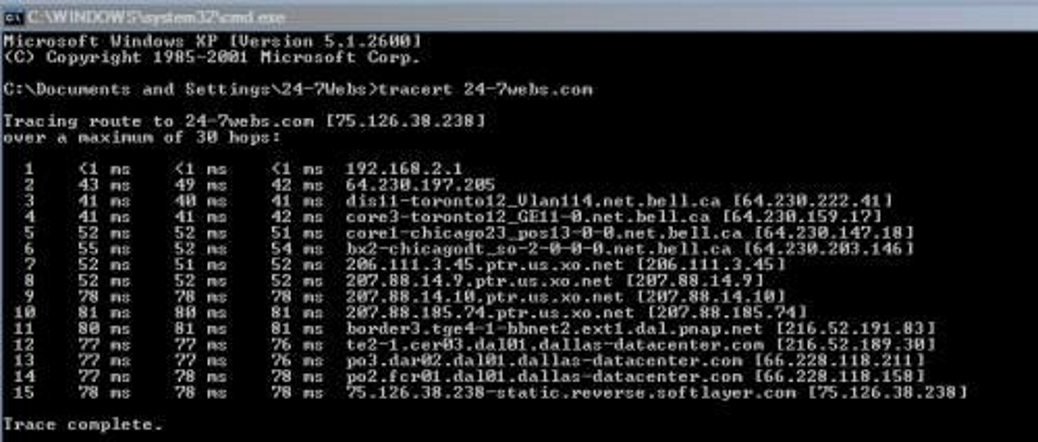
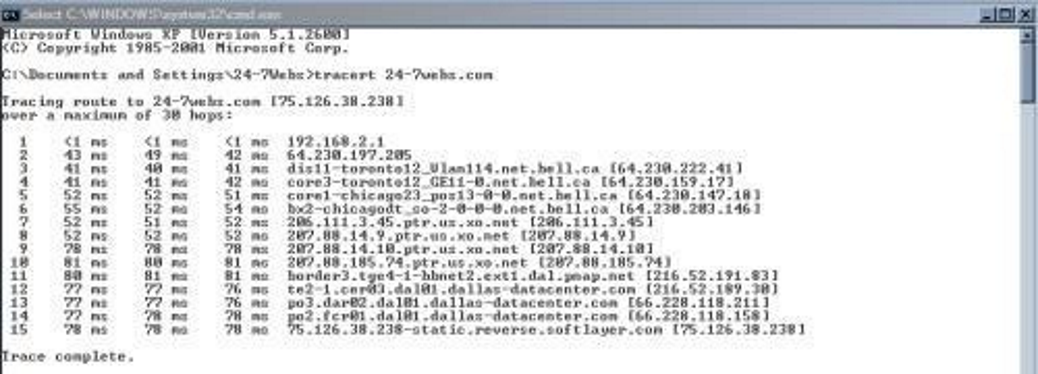
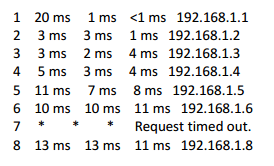
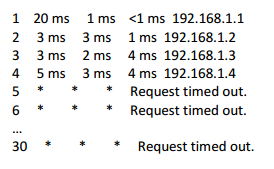
The Traceroute tool is used to map the hops between the end user and the destination server. This can help determine where any issues may lie on the network. The examples below were collected after tracing a route to server 192.168.1.8, over a maximum of 30 hops. They show a good traceroute, then two bad traceroutes; one a failed hop, and one a routing loop.
Example: a good traceroute
The following example shows a good traceroute.
You can see each step the data takes when it travels to the destination server of 192.168.1.8. These are called hops, and represent a system or router the data passes though. As you can see, hop 7 in this example has not responded, but hop 8 has, meaning that hop 7 is not responding to the request but is handling the packets properly and forwarding traffic to the next hop.
Example: a failed hop
In the good traceroute example earlier, hop 7 was not responding to the request, but had not failed, as it was forwarding traffic to hop 8. The result of a test where one hop isn't responding, and is not forwarding traffic, would look something like this:
This shows the test failing at hop 5, and continuing to fail all the way to hop 30 (the default max hops for the trace route tool) this means that hop 5 is unresponsive and not responding, or forwarding traffic for subsequent hops.
Example: a routing loop
When a routing loop occurs it stops data from reaching the final destination. Unlike the failed hop, the routing loop simply loops data back and forth between two hops. In the example below, a loop has occurred between 192.168.1.4 and 192.168.1.5. Data will pass back and forth from one to the other until the session times out or, in this particular case, the maximum hop limit is reached.
Note:
You will often see this if the end user has been 'wall gardened'. A 'walled garden' refers to a browsing environment that controls the information and Web sites the user is able to access. This is a popular method used by ISPs in order to keep the user navigating only specific areas of the Web. This is often for the purpose of shielding users from information, such as restricting children's access to unsuitable material.
Using Ping
Ping is a network utility used to see if the end user can reach other devices connected to the internet. When using Ping, always test a few different sites to see if it is just one site or all sites.
To ping a device, proceed as follows.
- Open a Windows Command Prompt window.
- At the command prompt, type, ping <IP address>, as shown below.
Note:
You can interrupt Ping at any time by holding down the CTRL key, and pressing C on your keyboard.
Understanding Ping results
Ping operates by sending ICMP Echo Request packets to the target device and waiting for an ICMP Echo Reply. The program reports errors, packet loss, and a statistical summary of the results.
Note:
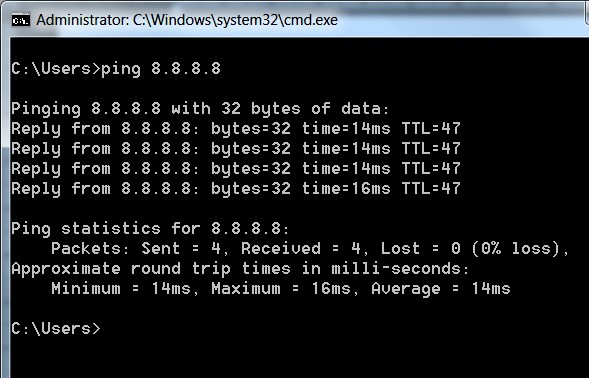
The Google DNS server IP address, 8.8.8.8, or the BBC server domain address, bbc.co.uk, are both commonly used as ping destinations to check outgoing connectivity.
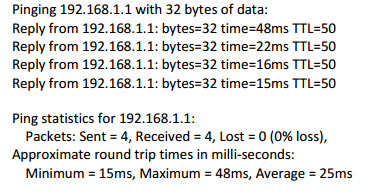
In the following examples, the Ping command was used to check the connection to device 192.168.1.1, with 32 bytes of data.
Example: a successful Ping
The following example shows the screen display after a successful ping attempt, where four packets were sent, and four packets received.
Example: target device not responding
A ping result, where the target device is not responding, or there is a connection issue, will look like this:
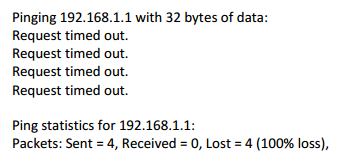
Although four packets were sent, none have been received, showing a 100% loss of packets, and indicating an issue with either the connection or the target device.
Note:
A result like this does not always mean the device is not online or working correctly. Many devices have ICMP ping responses disabled for security or service reasons. So even if they are up and running it will appear as if they are unreachable.
Example: a longer test
Unfortunately, a sample set of four pings is not suitable for detecting packet loss, so we need to run a longer test. This is done by adding the –n option flag, followed by the number of pings you want performed, as in the following example; ping –n 500 192.168.1.1 .
This will ping the target 500 times, and fill the screen with every ping sent. We don't need to view every ping, just the final result, which will look like this:
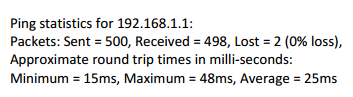
As you can see in this test we dropped two packets but, due to the large sample size, this is negligible and is well within working parameters. If we had a sample size of just four pings this would be a loss of 50% and would not be a true reflection of loss on the circuit.
We judge packet loss on a case by case basis. If significant loss is seen, we require some further testing using either PathPing or the MTR utility.
Understanding MTR (MyTraceRoute)
MTR (MyTraceRoute, originally called Matt'sTraceRoute) is a computer program that combines the functionality of the Traceroute and Ping programs in a single network diagnostic tool.
MTR probes routers on the route path by limiting the number of hops that individual packets may traverse, and listening to responses of their expiry. It will regularly repeat this process, usually once per second, and keep track of the response times of the hops along the path.
An MTR test result as shown here would point to issues with DNS resolution:
'Ping request could not find host google.com. Please check the name and try again.'
If the end user is able to ping an IP address, but can't ping a domain name, such as bbc.co.uk, then there is likely an issue with their DNS setting.
Using PathPing
This network utility is a more advanced version of the Ping tool, which performs a ping to each hop along the route to the destination (unlike Ping, which just pings from the originating device to the destination device). It is extremely useful in diagnosing packet loss, and can help with diagnosing slow speed faults.
To PathPing a device, proceed as follows.
- Open a Windows Command Prompt window.
- At the command prompt, type, pathping <IP address>, as shown below.
Note:
You can interrupt PathPing at any time by holding down the CTRL key, and pressing C on your keyboard.
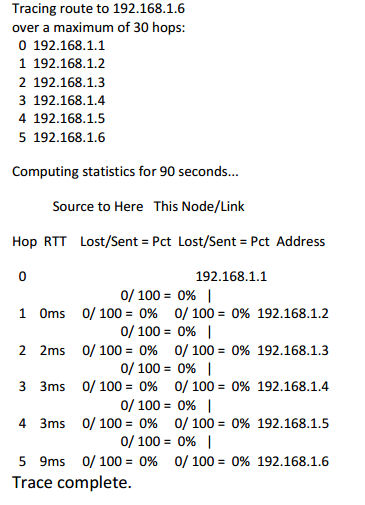
Understanding PathPing results
The advantages of PathPing over Ping and Traceroute are that each node is pinged as the result of a single command, and that the behaviour of nodes is studied over an extended time period, rather than the default ping sample of four messages, or default traceroute single route trace. The disadvantage is that it takes a total of 25 seconds per hop to show the PathPing statistics.
In the following examples, the PathPing command was used to check the connection to device 192.168.1.6, over a maximum of 30 hops.
Example: successful pathping
In the example, there were five hops along the route from the origin, 192.168.1.1, to the destination, 192.168.1.6. At each hop, 100 packets were sent and no packets lost.
Example: failed pathping
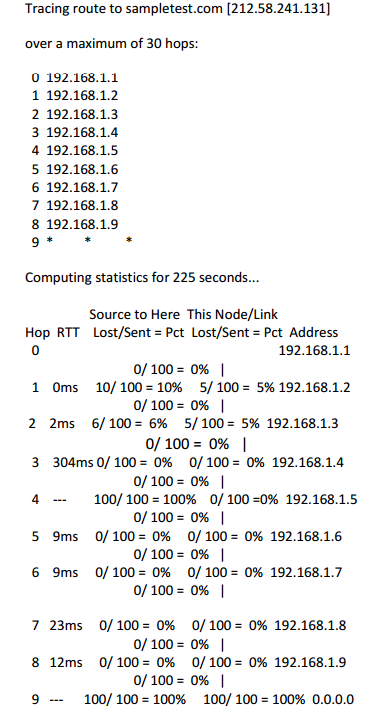
The example illustrates some of the different results you might encounter. Look at each of the hop results, and what they signify. In the example, we will focus on hops 1, 3, 4, and 9.
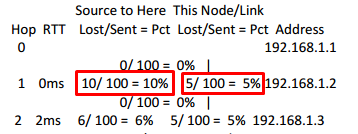
The 10/100 = 10% shows that there were 10 dropped packets out of 100 which were sent directly to that hop. The 5/100 = 5% shows it dropped 5 packets that passed through the hop.
Note:
On the second hop, the 6/100 = 6% indicates the packet loss is continuing, however this is likely due to packets being dropped by the first hop when testing, and not an issue with the second hop.
A result showing loss from the first hop indicates the likely cause to be the originating end user's router, and would be reflected with the IP address of the router (such as 192.168.0.1). In this instance, check, and if necessary replace, the router, then retest. If the loss is evident from a hop after the originating router (most likely hop 2 onwards), then the issue should be raised to the service provider.
Looking at hop 3,
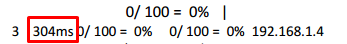
No packets have been dropped on hop 3, but it does have an abnormally high ping response time of 304ms. This could indicate that the hardware on that hop is not performing correctly, and this may be causing high response times and slow speeds. If the hardware on that hop is not performing correctly, you would see high ping times on all subsequent hops, in which case, investigate the hardware on that hop.
Looking at hop 4,
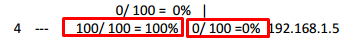
As you can see this hop has not responded to any pings sent to it, but has not dropped any pings sent through it. As mentioned in, Understanding ping results, this is due to the server not responding to ICMP ping requests for security or service reasons and does not indicate a problem.
Looking at hop 9,
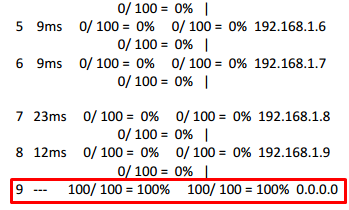
Everything on hop 5 to 8 is fine and everything looks normal, but hop 9 does not.
When you see the 0 hop repeated, followed by 0.0.0.0, this means the hop is not responding to the ping correctly. Unfortunately, this is a limitation of the PathPing tool and the way it handles ping responses.
