
Provide Azure Redesign
The Provide portal's Azure module has undergone the first phase of an extensive revamp, giving you faster access to timelier and more accurate spend data. These updates include:
- Significant performance improvements, including more up-to-date spend data
- A complete redesign of the UI
- Introduction of new headline figures and associated insights
- Enhanced charting capabilities to analyse spend and forecasts
- Improved budgeting tool
- More in-depth analysis of Recurring Spend
- Dedicated export tool
This article aims to give you a more detailed insight into the changes that have been released, and what more exciting additions there are to come. It also includes a 'Where do I find…' section if you are looking for something that was in the previous version of the module. If you have any feedback on the new look Azure module, please use the 'Send Feedback' function found above your username in the sidebar.
Key Features
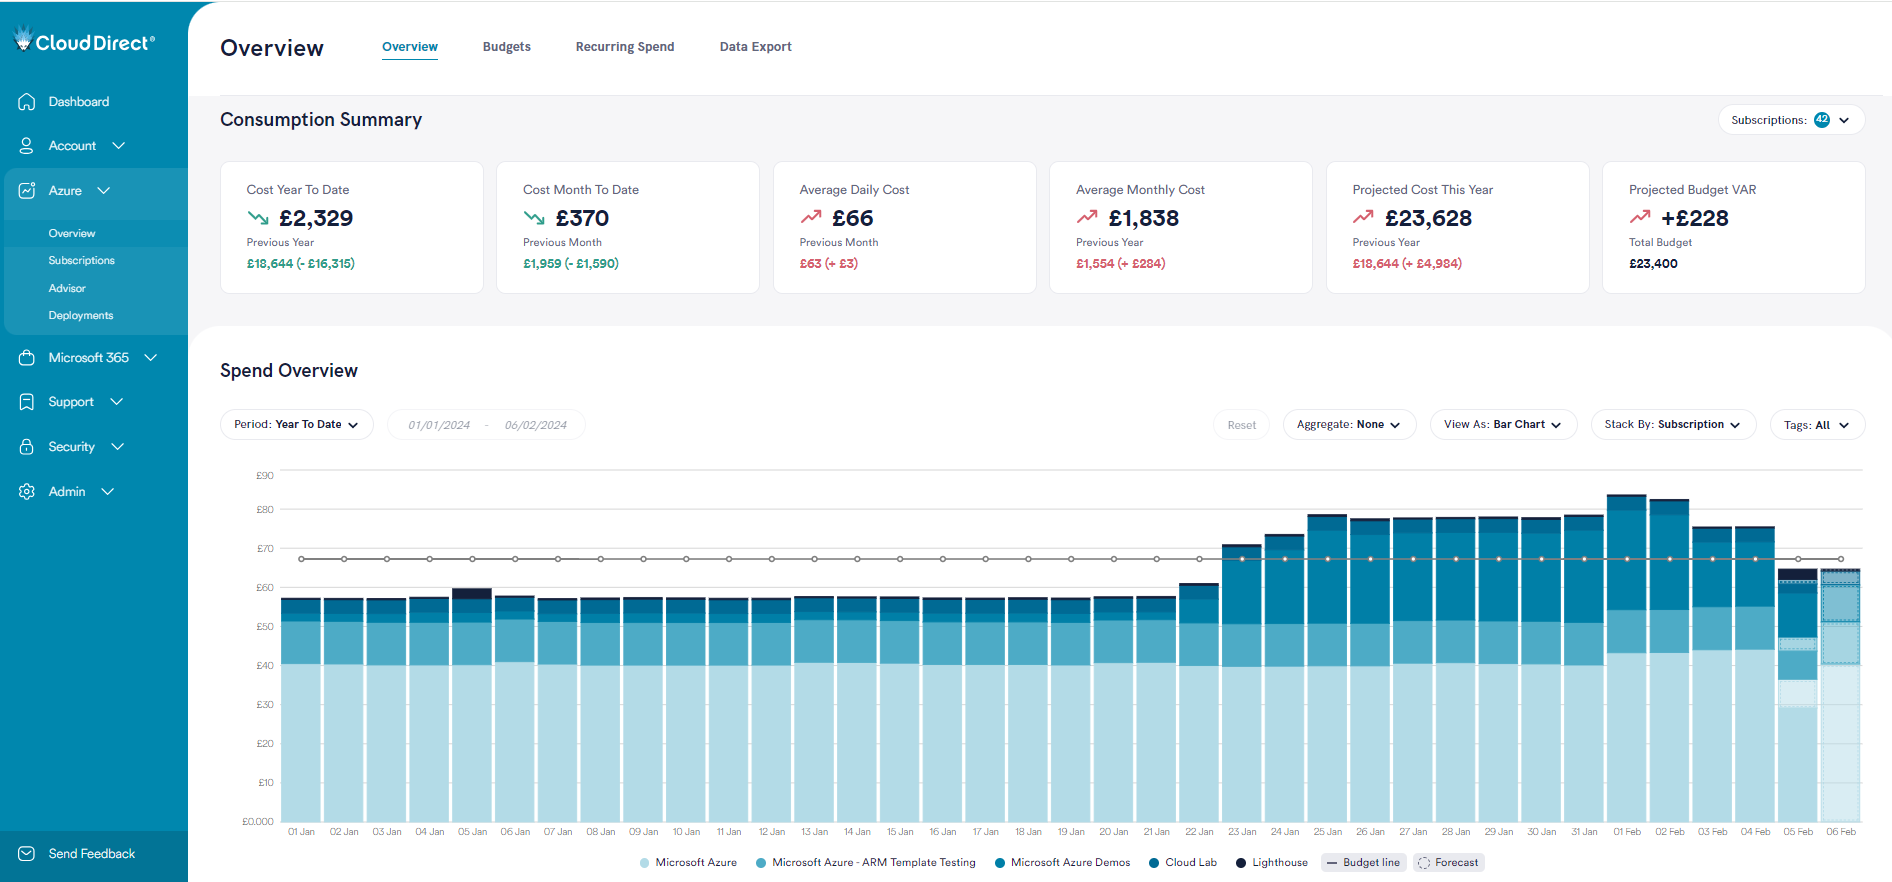
Overview
Azure Spend Summary
A quick view of your total year-to-date spend (including recurring spend), as well as your total projected spend for the year.
Consumption Summary
Key data highlights to show your current spend. Also includes comparisons to your budget or previous period's spending.
These tiles can be filtered by Tenant/Subscription using the Subscription picker.
Spend Overview
The main graph gives you multiple options to analyse your spend data, meaning you can customise the view to suit your requirements. The graph will also include forecasting data and a representation of any budgets you have set.
The graph options available are:
- Period:
- Year to Date – All spend so far this year
- Current Year – All spend so far this year, plus a forecast for the remainder of the year
- Previous Year – All spend for the previous year
- Month to Date - All spend so far this month
- Current Month - All spend so far this month, plus a forecast for the remainder of the month
- Previous Month – All spend for the previous month
- Custom – Ability to view up to 18 months of historical spend
- Aggregate:
- None – Spend and forecast will be shown per day/month depending on the selected period
- Cumulative – Spend and forecast will be shown as a running total
- View As:
- Bar Chart – Spend and forecast are shown in a bar chart, with multiple Stack By options.
- Area Chart – Spend and forecast are shown in an area chart, with multiple Stack By options.
- Table – Exact spend figures are shown in tabular format (no forecast is available)
- Line – Spend and forecast are shown as a single line (no Stack By is available)
- Stack By groups spend and forecast in the graph by Tenant, Subscription, Service, Region or Resource Group.
- The Tags filter allows the filtering of spend in the graph by up to 10 tags at a time. This filter is searchable – begin typing to start a search.
- Ledger selections allow you to switch off elements of the graph such as forecasting or budgets. They also allow you to drill down further into the data by selecting a subset of the displayed items EG. Tenants.
This section also includes Pie and Bar charts showing a breakdown by Tenant/Subscription/Service/Region/Resource Group for the selected period and tags. These do not include any forecasting figures.
The entire section can be filtered by Tenant/Subscription using the Subscription picker.
Budgets
Monthly budgets can currently be set at a Tenant level, which are then reflected as a total annual budget.
Select the pencil icon to set or adjust a budget for a Tenant. A flyout will then open giving you information about a Tenant's forecasted spend, and whether an existing budget is likely to be breached. You can then set a new monthly budget by entering a value and clicking 'Save Budget'. To unset a budget you can enter a value of 0.
Recurring Spend
Reserved Instances and Software Subscriptions are now combined into a single Recurring Spend page. The Spend Year To Date tile will reflect any invoiced amounts this year, whilst the Average Monthly Spend and Projected Yearly Spend tiles use a rolling prediction algorithm to show likely costs.
Recurring Cost
A table showing all Reserved Instances and Software Subscriptions across all Tenants/Subscriptions. By default, this list is filtered to only show Active items but can be extended to also show Cancelled and Expired. Expired items will be highlighted in the list.
The Total Charge column represents the total value that has been invoiced against the recurring item. The Last Charge column represents the last value invoiced against the recurring item.
Use the Export button to download a CSV file version of this table.
Spend Overview
This graph gives you multiple options to analyse your recurring spend data, meaning you can customise the view to suit your requirements. The graph is based on invoiced amounts, so may appear to be a month behind real-time.
The graph options available are:
- Period:
- Year to Date/Current Year – All invoiced recurring spend so far this year
- Previous Year – All invoiced recurring spend for the previous year
- Month to Date/Current Month - All invoiced recurring spend so far this month
- Previous Month – All invoiced recurring spend for the previous month
- Custom – Ability to view historical, invoiced recurring spend over any time period
- Aggregate:
- None – Spend will be shown per month depending on the selected period
- Cumulative – Spend will be shown as a running total
- View As:
- Bar Chart – Spend and forecast are shown in a bar chart stacked by Recurring Item
- Area Chart – Spend and forecast are shown in an area chart stacked by Recurring Item
- Table – Exact spend figures are shown in tabular format stacked by Recurring Item
- Line – Spend is shown as a single line (no Stack By is available)
- Ledger selections allow you to drill down further into the data by selecting a subset of the displayed recurring items.
Data Export
Exporting Data
The raw data supporting Provide's Azure Spend analysis can be downloaded on a monthly basis in CSV format. Simply select the required month and then click 'Export Data'.
Data Export Example/Column Descriptions
The rest of the Data Export page gives you an insight into the data you will be downloading. The Data Export Example shows you the formats to expect for each column, and the Column Descriptions explain what each part of the data represents.
Coming Soon
There is a phase two to the new look Azure section of the Provide portal. This will be released in the first half of 2024 and will include further enhancements and new features.
A new Resource Explorer will be added, giving you access to a decomposition-style graph in order to drill down through your spend data.
A new Trends and Insights page will aim to give you suggestions on how to optimise your Azure spend and highlight potential issues before they get out of hand.
The Data Export functionality will be expanded to include the option to schedule exports and have them sent to a pre-determined location.
Where do I find…?
Plan Breakdown (Reserved Instances/Software Subscriptions)
Reserved Instances and Software Subscriptions can now be found on the Recurring Spend tab of the Overview Page.
There is a more detailed analysis of your recurring spend available, but you can also still find the previous level of detail per-Reserved Instance/Software Subscription by clicking on the relevant record in the table.
Usage By Subscriptions
This data is now all included within the Overview page.
The whole page can be filtered by the Subscriptions picker at the top right of the Consumption Summary section.
The Pie/Bar charts for Services/Resource Groups/Regions are now included at the bottom of the Overview page.
Usage By Resource
Some of this data is now included within the Overview page.
The whole page can be filtered by the Subscriptions picker at the top right of the Consumption Summary section, and the Spend Overview graph can be stacked by Resource Group.
The ability to drill down from Subscription to Meter is not currently available but will be replaced by a decomposition-style Resource Explorer in a second phase to be released soon.
The export of your raw usage data is now available through the Data Export tab of the Overview page.
