Understand Your Sales Performance With Power BI Sales Dashboard

“From good to great”
Users of Dynamics 365, Microsoft’s cloud CRM system, benefit from numerous sales dashboards and views, which sales teams can customise to fit each individual’s needs. Highly flexible, these report right across the selling process and show the status of your sales pipeline.
This is good.
However, if you want to be really great, then our advice is to drive sales performance by gaining crucial insights from the sales data you already have in Dynamics 365, by connecting it to Power BI.
Our sales and marketing teams have been using Power BI since the summer of 2016, and the depth and simplicity of analysis have transformed the business. That’s because Power BI offers significantly greater reporting power, so we can visualise performance, understand trends and discover fresh and valuable insights. We can act quickly on these insights, amend our campaigns, and easily find out if they’re working or not.
This is great.
Why boost your CRM with Power BI?
Let’s take a look at how Power BI Sales Dashboard can improve your sales analysis by looking at these four key areas:
-
Sales pipeline
-
Sales quota
-
Sales trends
-
Sales performance
1. The Power BI sales pipeline dashboard
This packs in a lot of detail. For example, you can see the number of opportunities created, a breakdown of opportunity values by customer type and the top opportunities by account.
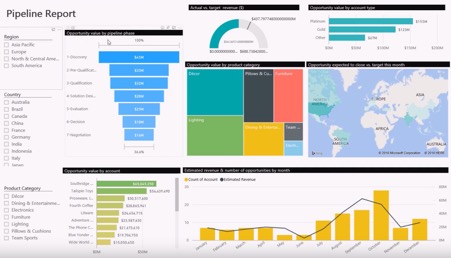
You can compare actual to target performance and identify which opportunities are at a more advanced stage, and primed for conversion, as below.
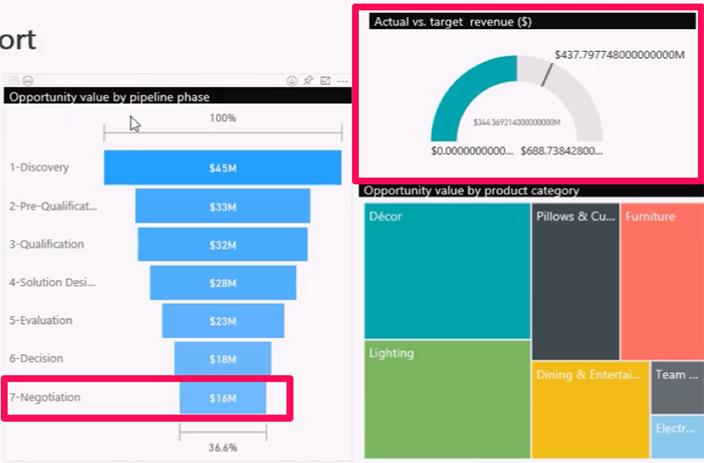
The second red outlined box in the above image shows the CRM opportunities at the negotiation stage total $16million. Now, if you look at the image below, you’ll see how we can drill down to see this breakdown by individual prospect. As you can see, Derek Brown accounts for $4m of this total.
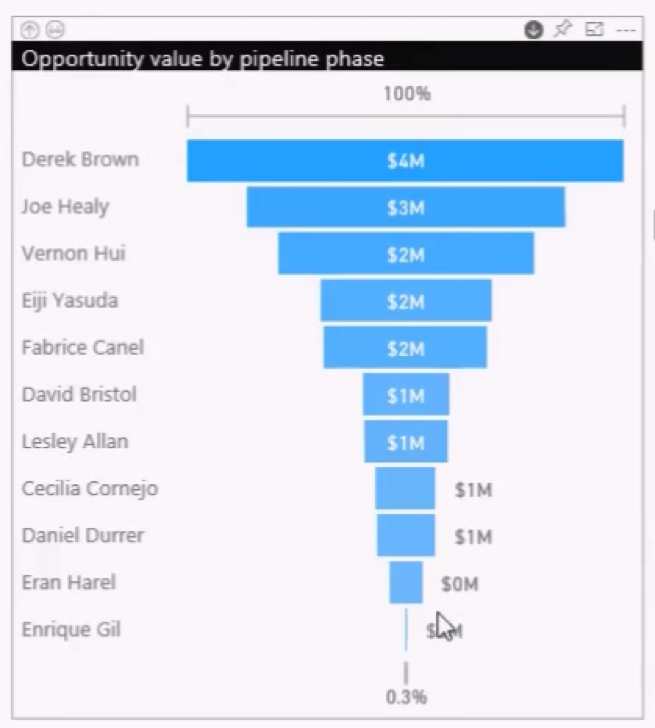
But does Derek’s $4m represent a single opportunity or multiple, potential deals?
With Power BI, we can click down to another level to see that Derek has one potential $4m order at this stage for his client, Southridge Videos:
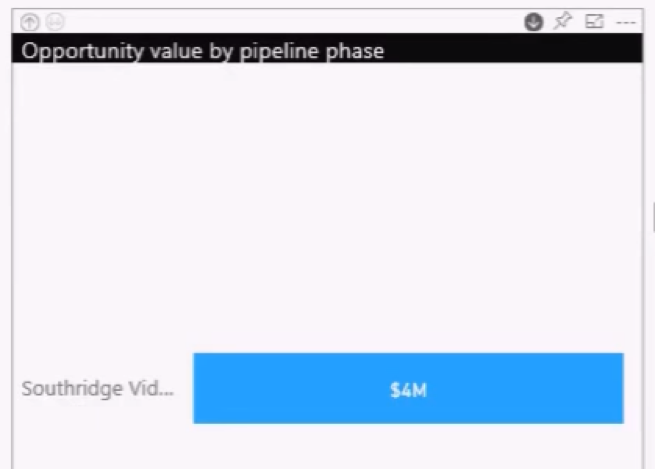
Now, a sales director can quickly follow up, working out the best strategy to get this deal over the line.
2. Sales quote – target metrics
The screenshot below reflects a global sales operation, but this could just as easily display UK regions.
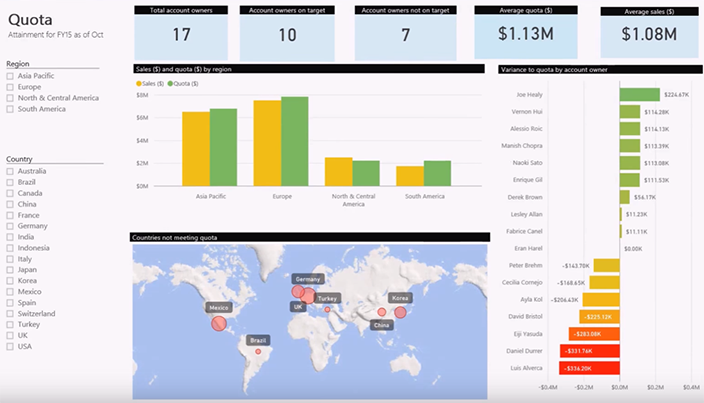
As you can see above, this organisation has sales managers behind target and 10 managers who will either meet or exceed their sales quota.
We can drill down into this data, so I’ll click on Europe, which the bar chart confirms is one of several territories where performance is down on target:
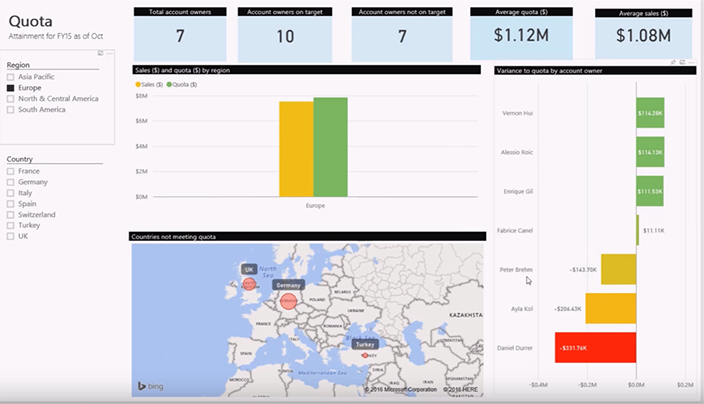
This filters down to the seven regional sales managers so a sales director can easily grasp how each of them is doing.
3. The Power BI trends dashboard
The trends dashboard of Power BI is a massive stride away from the fairly flat reporting within the Dynamics 365 CRM interface. This is because the Power BI trends dashboard directly compares and overlays performance between two time periods, as follows:
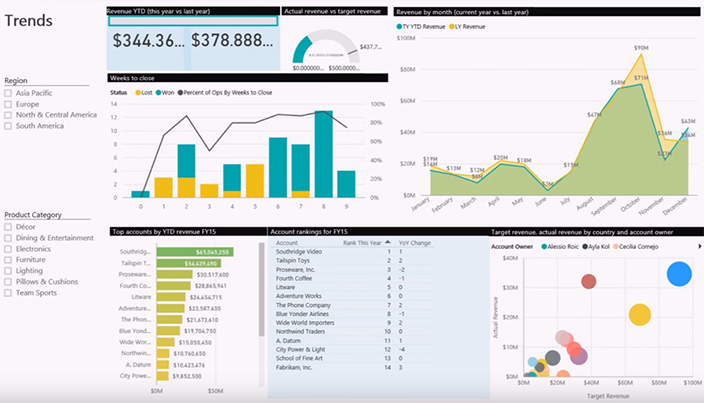
If we look at the revenue by month chart, we can see that this year’s performance has consistently trailed the previous 12 months – most notably during October and November. With Power BI, we can drill down to find out the cause of this.
We can also see that opportunities are taking an average of six to eight weeks to convert, and that more opportunities are likely to drop out after five weeks. With Power BI, we can find out why this is as well as, for example, at what stage the opportunities are being lost.
Still on the screenshot above, take a look at the account revenue list. You can see how the top customers rank this quarter, or year, and how this compares to an earlier period. You can see which customers are growing and which ones are slipping down the leader board in terms of revenue.
4. Power BI sales performance dashboard
This is where sales leads can analyse profit margins.
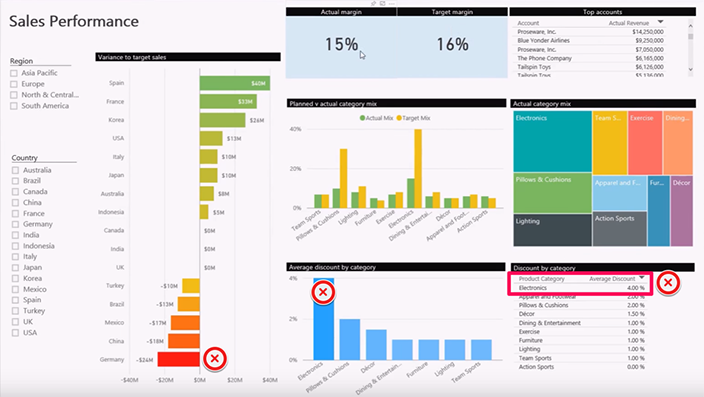
You can see that the headline figure in the example above shows the target margin slightly down on the target margin for the year to date.
We can also see the significant sales variances across the various categories and countries. For example, five countries are falling well short of target, with Germany performing particularly badly. On the contrary, Spain and France are massively outperforming.
But what’s going wrong with Germany’s sales effort? How do the performance of furniture and décor sales compare to previous periods?
Click on the graphic and it dynamically filters the dashboard to answer these kinds of questions. Let’s look at Germany’ s sales, displayed below. This could just as easily be displaying data for, say, London, Birmingham or Scotland.

Talk to a Power BI expert
Want to find out more about a Power BI Sales Dashboard? Get in contact with us to talk to one of our experts.


